
How to improve your Google Ads conversion rate

There are two opposite ways to push up your Google Ads conversion rate: win more customers, or cut traffic. Both put exactly the same number on your screen, and only one of them makes you richer.
That's what the guides on the subject never tell you. They line up ten tips on the same footing, negative keywords right next to landing page improvements, without warning you that the first one pushes the percentage up without adding a single sale.
How the Google Ads conversion rate is calculated
The calculation divides the number of conversions by the number of interactions that can be tracked to a conversion, in other words clicks on the Search Network. Impressions don't come into it.
A hundred clicks and five sales give you 5%. Our conversion rate calculator does the math, and the variations too if you want to test a few scenarios.
The formula looks harmless. Yet it holds the whole problem this article is about: a rate is a fraction, and a fraction goes up just as well when its numerator grows as when its denominator shrinks.
What is a good conversion rate for Google Ads?
The median across all industries stands at 8.18%, according to the annual benchmark report published by WordStream, measured on 13,474 US campaigns between April 2025 and March 2026.
That number will be almost no use to you, and the gaps between industries in the same report show why.
Be careful not to confuse it with your website's conversion rate, which is counted in sessions rather than ad clicks, and which hovers around 2%. The two share a name and measure two different things: what a good ecommerce conversion rate looks like covers the second one.
| Industry | Median conversion rate |
|---|---|
| Animals and pets | 16.22% |
| Automotive repair, service and parts | 15.51% |
| Education and instruction | 13.14% |
| All industries | 8.18% |
| Career and employment | 3.05% |
| Furniture | 2.99% |
| Finance and insurance | 2.64% |
A sixfold gap from first to last. An insurer at 3% is doing better than fine, a pet store at 9% has a problem, and both would misread the overall average.
The gap comes down to two things. The product first: people reorder a bag of kibble without a second thought; nobody switches life insurance in three clicks. And the counting second, where nobody plays by the same rules, which is what the sixth section is about.
Why does conversion rate go up when sales go down?
Here's the arithmetic I haven't seen explained anywhere on this subject, and it fits in two lines.
An account gets 100 clicks and 5 conversions, so 5%. To get to 10%, there are two paths, and they have nothing to do with each other.
- win customers: the 100 clicks stay, conversions go up to 10. You have five more sales and your revenue follows;
- cut traffic: the 5 conversions stay, clicks drop to 50. You don't have a single extra sale, but your spend is cut in half.
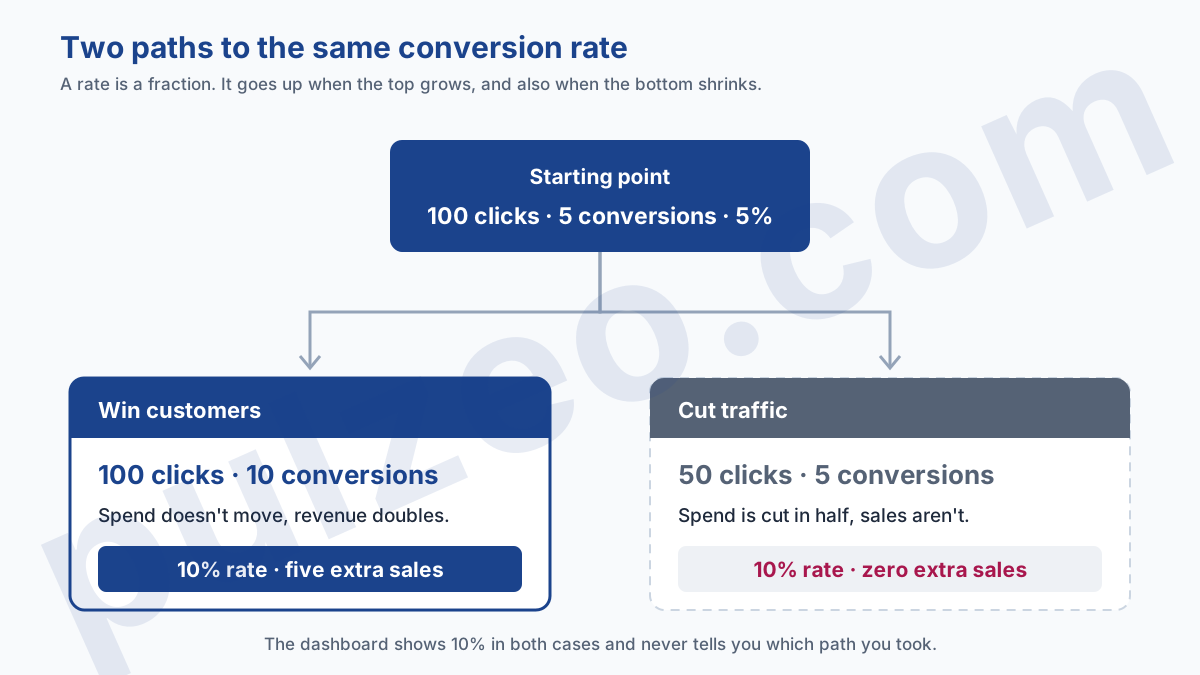
The second path isn't bad in itself. If those fifty clicks never converted, removing them saves money, and that's an excellent move. But if they converted a little, you've just shrunk your business while applauding the metric going up.
The rate shows 10% either way and will never tell you which path you took.
The levers that bring in more customers
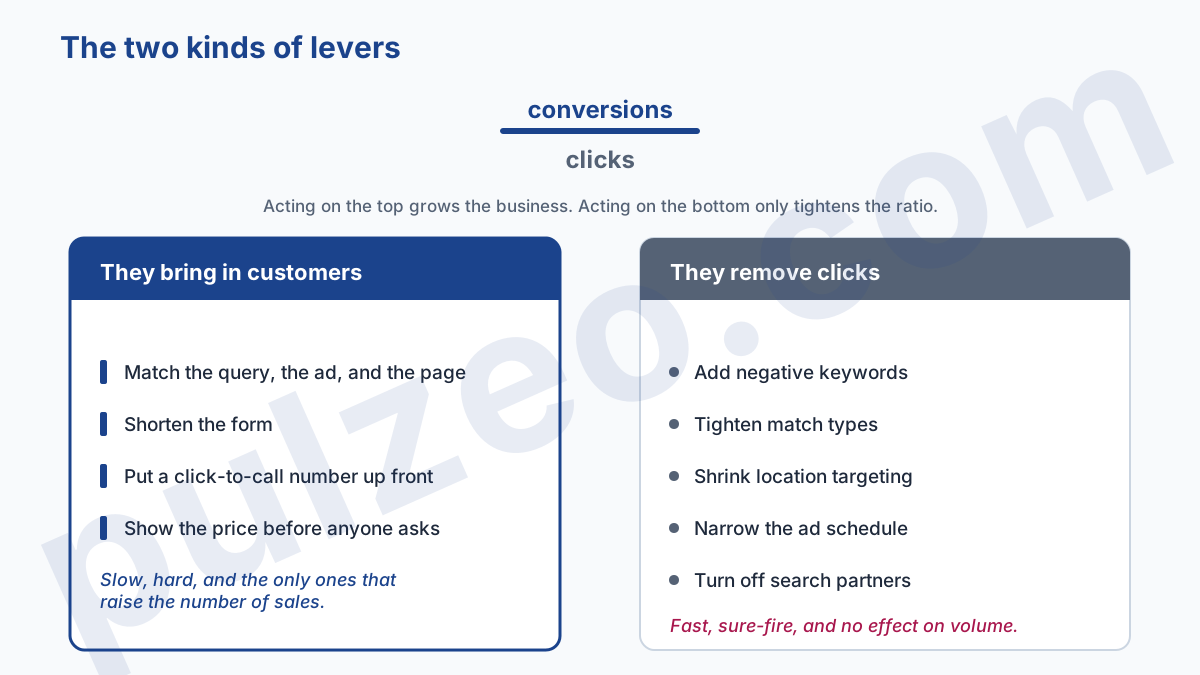
These work on the numerator. They're slower, harder, and they're the only ones that grow the business.
Match the query, the ad, and the page
It's the most profitable lever, and the most neglected. Someone who types "women's waterproof hiking boots" should see an ad that talks about women's waterproof hiking boots, then land on a page that shows them. Every break in that chain costs you some of your visitors.
The classic mistake comes down to one page: sending all the traffic to the home page. Visitors then have to redo the search they had just done on Google, and some of them give up along the way.
Three checks are enough to spot the break, and they take two minutes. Click your own ad from a phone, the way a customer would, then look at the landing page:
- does the word you typed appear on the first screen, without scrolling;
- is the action you expect, a button or a form, visible in that same spot;
- is the price, if it matters in your line of business, shown before anyone has to ask for it.
The search terms report shows the real queries behind your clicks, and that's where the mismatches show up. Pulzeo sorts those terms every day and surfaces the ones that spend without ever converting.
Ask less of your visitors
Every form field, every step, every account to create loses people. A contact form that asks for name, email, phone, company, headcount, budget, and a message converts worse than a three-field form, and that's not a matter of taste.
To know which step loses the most people, you first have to count it: that's the method in 5 steps to build your conversion funnel.
The same reasoning applies to the phone. Plenty of industries convert better on a call than through a form, and a click-to-call number at the top of the page sometimes does more than a month of design tweaks.
The levers that tighten the ratio without adding anything
These work on the denominator. They work fast, they always work, and that's exactly what makes them dangerous.
Adding negative keywords, tightening match types, shrinking your location targeting, narrowing your ad schedule, turning off Google search partners: each of these removes clicks, so it pushes the percentage up.
The most troubling part is that two of them appear on Google's help page on the subject, filed right next to conversion tracking and showing prices in your ads, with nothing to set them apart.
Specific keywords often tend to have a better conversion rate than general keywords.
The sentence is accurate, and it isn't advice on how to sell more. A specific keyword draws fewer people and converts those people better, so it pushes the rate up and the volume down. What's wrong is the conclusion people instinctively draw from it, not the statement.
These levers remain perfectly legitimate when the traffic you remove wasn't earning anything. The trap with negatives lies elsewhere, in broad match negatives that cut far more than you meant to: the mechanism is explained here, and it costs sales to accounts that thought they were just tidying up.
What you count as a conversion changes the number
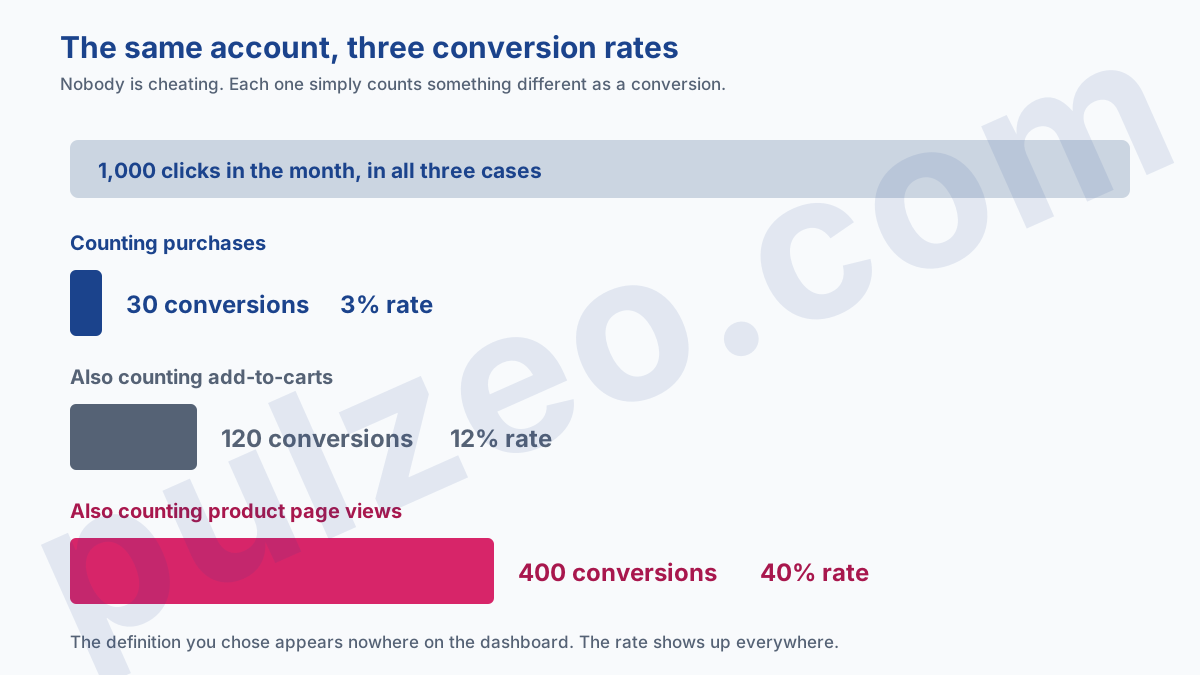
Two identical accounts can show 3% and 40% depending on what they've set up as a conversion. The one counting purchases sits at 3%; the one also counting product page views and add-to-carts sits at 40%.
Neither is cheating, and that's exactly the problem: a conversion rate only means something against its definition, and that definition appears nowhere on the dashboard.
The subject has its own traps, including the "Conversions" column that drives bidding and the duplicates that inflate the count. They're covered in the guide to the six tracking settings that skew everything.
Three reasons your rate moves when you haven't changed anything
Before you attribute a change to one of your own actions, rule out these three causes. They explain most of the swings I see reported as mysteries.
Conversion delay, the most common cause
Google counts a conversion on the date of the click that produced it, not on the date it happens.
The primary conversion columns mentioned above are calculated based on the time of the click, not the time of the conversion.
The consequence is unavoidable: your last thirty days are always undercounted, since conversions will still be added to them. With the conversion window left at its default of thirty days on the Search Network, Google itself recommends only judging a date range that ended at least 30 days ago.
In other words, last week's rate isn't bad, it's incomplete. Segment your conversions by Days to conversion to see how fast yours come in, and you'll know how much lag to allow for.
A change in bidding or budget
Switching to Maximize conversions doesn't make your page any better, but it has Google buy different clicks, usually better targeted ones. The rate then goes up without you touching anything on the site, and it will come back down if you switch back to Maximize clicks.
The effect is similar in the opposite direction when you raise a budget: the first auctions you win are the most relevant ones, and the ones you buy after that are less so.
The mix of devices and channels
An aggregate rate adds together phones that convert poorly and computers that convert well. A campaign whose mobile share grows sees its overall rate fall even though neither device has moved.
It's the same mechanism as the industry average at the start of this article, applied to your own account: an aggregate number hides the mix that produced it. Segmenting by device settles the question in ten seconds, and it's worth doing before you rebuild a landing page for nothing.
The extreme case is Performance Max, which serves across six channels at once: Search, Maps, YouTube, Discover, Gmail, and Display. Those channels don't convert at anything like the same pace, and the split between them isn't yours to decide.
So the overall rate of a campaign like that can't be compared with a Search campaign's, or even with its own from the month before if the mix shifted in between. What you can still read in this type of campaign, and where to start, is covered in getting Performance Max out of its black box.
The rate says nothing about what you sell
One last blind spot, and it's an expensive one for large catalogs. Two campaigns both showing a 10% conversion rate can have wildly different results, if one sells a $30 accessory and the other a $300 product.
Optimizing for the rate inevitably pushes you toward the first, because cheap products get decided on faster. You'll then watch your rate and your number of conversions go up while your revenue goes down, which is the most baffling way to get it wrong.
The fix is to track conversion value rather than the number of conversions, and to think in terms of return on ad spend as soon as your products don't all sell at the same price. The math, and the margin caveat, are in the article on what ROAS really measures.
How to tell which of the two you just pulled
The answer comes down to three columns you have to read together, and never the rate on its own.
Look at the absolute number of conversions, the cost per acquisition, and the rate. If the rate goes up and conversions go up too, you've won customers. If the rate goes up while conversions go down, you've cut traffic, which is only good news if your cost per acquisition clearly improves.
One precaution before you conclude anything: below thirty or so conversions a month, these three numbers move on their own from one month to the next, to the point where a 30% swing in your cost per acquisition proves nothing. How those ranges are calculated is in the article on which metrics to track.
Where to start
Pull the search terms report for the last thirty days and sort it by cost, highest first. The queries that ate budget without ever converting are your candidates for negatives, and this time you'll know you're improving your efficiency, not your volume.
Then take the query that earns you the most and follow the full path, from the ad to the landing page, the way a customer would. It's the most boring job on the list, and it's the only one that really raises the number of sales.
One last possibility, worth considering seriously before you set off on another month of tweaks. If your rate already holds up against your own history and the number of sales stays low, your problem is no longer the rate: it's the search volume for what you offer, or the budget you put behind it. Optimizing a percentage that's already fine won't create the demand that's missing.
Common questions
Is your industry's average conversion rate a target to hit?
No, it's a reference point and nothing more. Industry medians range from 2.64% in finance and insurance to 16.22% in animals and pets, a six-to-one gap that comes down to the product being sold and to what each advertiser decides to count as a conversion. The only useful comparison is your own history, with your conversion definition unchanged.
Is conversion rate calculated on clicks or on impressions?
On interactions, meaning clicks in a Search campaign. Google divides the number of conversions by the number of interactions that can be tracked to a conversion over the same period. Impressions never enter the calculation.
Should you add negative keywords to improve your conversion rate?
It works every time, and that's exactly the trap: removing clicks that weren't converting pushes the rate up without adding a single sale. The move is a good one when those clicks were costing you money, a bad one when it trims traffic that converted a little. Check the absolute number of conversions before you congratulate yourself.
Why does my conversion rate drop when I increase my budget?
Because a bigger budget buys less qualified traffic. The first auctions you win are the most relevant ones; as you scale up, you pay for searches further from your offer, which convert less. A lower rate alongside a higher number of conversions is therefore not a problem, as long as your cost per acquisition holds.