
Which Google Ads metrics should I track?

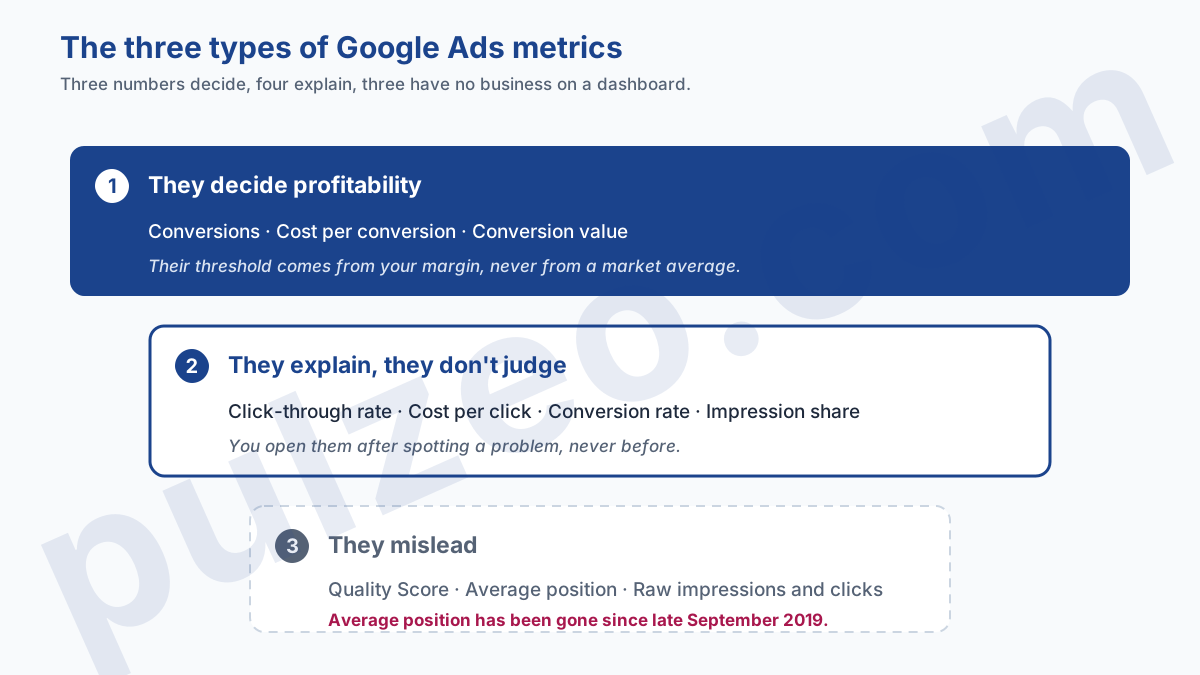
Three Google Ads KPIs decide whether your account makes money: the number of conversions, what they cost, what they bring in. All the other Google Ads metrics (click-through rate, cost per click, Quality Score) are there to help you understand why those three move.
Most pages on the subject hand you the same ten metrics in the same order, each with its definition. None of them tells you what value is normal, which one lies, or how much volume it takes before a number means anything. Those are the three questions you actually ask yourself in front of a dashboard.
The three metrics that decide your profitability
The number of conversions, their unit cost and their value are enough to tell whether the account is healthy. None of the three is judged against a market average: their thresholds come from your own business.
Your cost per acquisition has a ceiling, and that ceiling is your gross margin per sale. A $40 cost per lead is excellent for a heat pump installer and ruinous for a florist. For a sense of scale, the annual benchmark report published by WordStream, based on 13,474 US campaigns between April 2025 and March 2026, puts the median cost per lead at $66.69 across all industries.
Note the word median, because it matters: on this kind of measurement, the average gets pulled up by a handful of outlier accounts.
Conversion value only means something once you set it against spend, and that's the whole point of return on ad spend. The calculation and its traps are in the article on what ROAS really measures, along with the caveat that changes everything: a ROAS of 4 is comfortable at a 60% margin and untenable at 15%.
Volume, finally, governs the other two. It's the subject of the fourth section, and it's the only metric that decides how reliable all the others are.
The diagnostic metrics: click-through rate, cost per click, impression share
These Google Ads metrics never tell you whether the account is profitable. They tell you why it is or isn't, which is a different question, and one you only ask afterwards.
A low click-through rate points to an ad or targeting that needs another look. A rising cost per click points to stiffer competition or slipping relevance. A falling conversion rate points to the landing page, not the campaign. Each of these numbers is a clue, not a verdict.
What the published averages are worth
For the Search Network, the same study of 13,474 campaigns reports a median click-through rate of 6.64%, a conversion rate of 8.18% and a cost per click of $5.42.
Three caveats to keep in mind before you compare yourself. The sample is US-only, it lumps Google Ads and Microsoft Ads together, and it groups industries whose internal gaps far exceed their distance from the average.
One more point that applies to everything you'll read elsewhere. Plenty of pages still quote an average search click-through rate of 3.17%. The figure is real, but it comes from the 2018 edition of the same study, measured on 14,197 US accounts between August 2017 and January 2018. Comparing yourself to it today is like grading your work on an eight-year-old curve.
Impression share and its two causes of loss
Impression share is the percentage of impressions you received out of all those your ads were eligible for. Its raw value doesn't tell you much. What's useful is the breakdown of what keeps you from 100%.
Google splits it into two causes, and they don't call for the same decision. Search lost IS (budget) means your ads stopped for lack of money, so the demand is there and you're not serving it. Search lost IS (rank) means you were in the running and lost the auction, which points back to your bid or the quality of your ads.
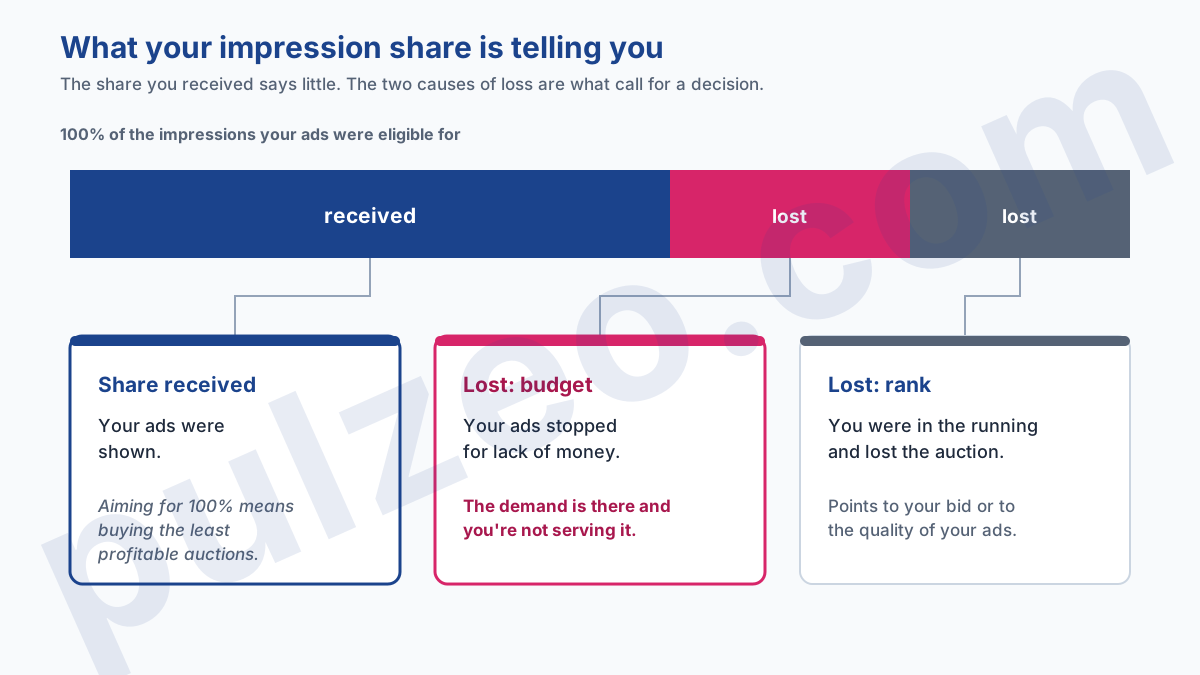
Google publishes no target for these three shares, and that makes sense: aiming for 100% impression share means buying the least profitable auctions in your market. Pulzeo, meanwhile, flags accounts whose visibility drops too low for the numbers to stay meaningful.
The metrics that mislead, including one that no longer exists
Three numbers show up on almost every dashboard even though they have no place there.
Quality Score, first. It's scored out of ten, it looks like a school grade, and everyone tries to push it up. Yet Google is explicit in its own documentation.
Quality Score is not a key performance indicator.
The same page adds that you shouldn't optimize it or combine it with your other data, and defines it as a diagnostic tool, meant to show how your ad quality compares with other advertisers'. It points you to the ad group where the message and the keywords don't line up, and it stops there. Tracking it month after month on a dashboard won't teach you anything.
Average position, next, and this one is more embarrassing: it disappeared from Google Ads at the end of September 2019. If you still see it in a report template, that template hasn't been touched since. Google replaced it with search top impression rate and search absolute top impression rate, which answer the real question: were you visible at the very top of the page?
Raw impressions and clicks, finally. They go up whenever you raise the budget, which makes them flattering and useless. Two charts whose only job is to fill a page.
How many conversions do you need before a metric means anything?
That's the question nobody asks, and it decides everything above. A metric calculated on a small number of conversions moves a great deal even when no setting has changed.
Conversions trickle in one by one, independently of each other, which is modeled with a Poisson distribution. Its standard deviation equals the square root of the expected number, and that's enough to give the ranges. Here's what chance alone allows, nineteen months out of twenty:
- at 8 expected conversions a month, the real count lands between 3 and 13, so your cost per acquisition can swing fourfold;
- at 30 conversions, it lands between 19 and 41, so your cost per acquisition can swing twofold;
- at 100 conversions, it lands between 80 and 120, and your cost per acquisition finally tightens to within 25%.
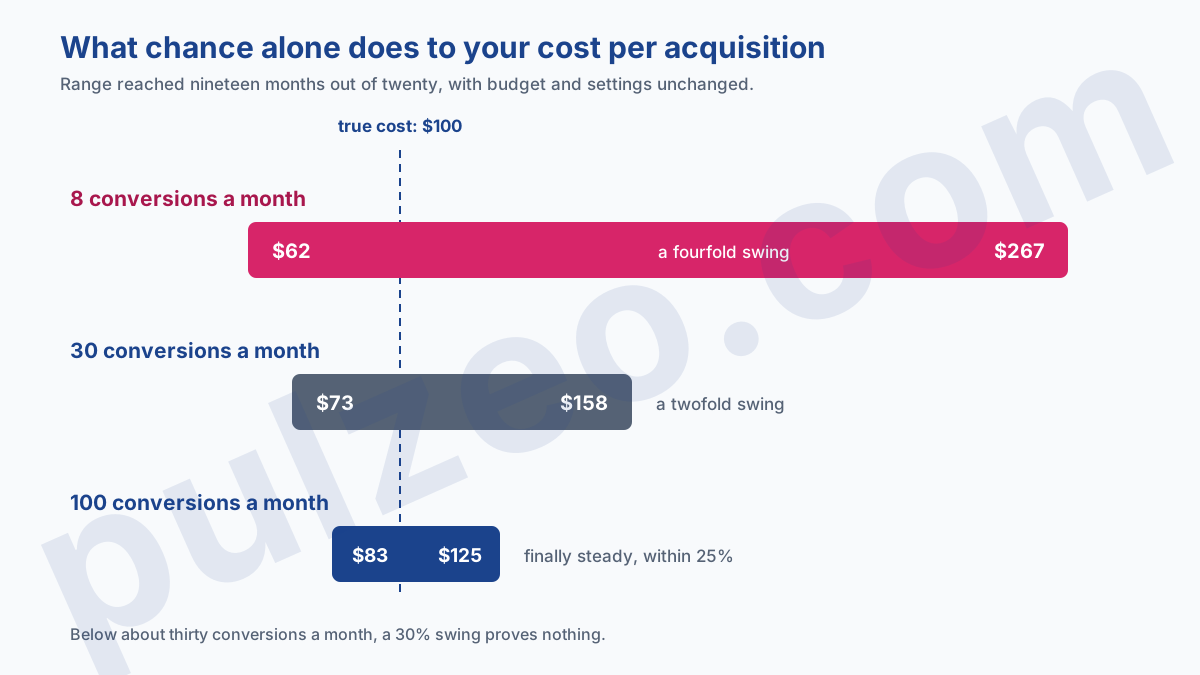
The practical consequence: below about thirty conversions a month, a 30% swing in your cost per acquisition proves nothing, and cutting a campaign on that basis is a coin toss. That threshold of 30 isn't mine, it's the one Google publishes for its own automated bidding, and it also sets an account's minimum budget: the full calculation is in the article on the minimum Google Ads budget.
Pulzeo shows this monthly volume on every account and alerts you when it drops below the threshold, before you make a decision on a number that doesn't hold up.
How often should you check your Google Ads KPIs?
The right cadence depends on how long a metric takes to settle, and the three groups aren't read at the same pace.
- every week, the search terms, the negative keywords to add and the campaigns limited by budget, everything that's quick to fix and expensive to leave lying around;
- every month, cost per acquisition, conversion value and return on ad spend, which need volume to settle;
- every quarter, the account structure, the bid strategies and how the budget is split between campaigns.
Checking your cost per acquisition every morning is the surest way to react to noise. The weekly pass in detail, in order and with how long each step takes, is in the article on the weekly routine for a Google Ads account.
Which metrics to put in a client report
A client doesn't want your ten metrics. They want to know whether it works, what it costs and what you're doing next. The three from the first section answer the first two questions, and one line of commentary answers the third.
Everything from the second group stays in your working dashboard. An impression share chart in a client Google Ads report calls for a ten-minute explanation that won't help anyone decide anything.
The full mechanics, including white labeling and the time it saves, are covered in the article on automating Google Ads client reports without losing your evenings, and it's exactly what Pulzeo's automated reports produce.
Where to start this week
Open your current dashboard and strip out everything that isn't a conversion, a cost or a value. What's left fits on three lines, and you'll finally read them.
Then look at your number of conversions over the last thirty days. That's what tells you whether you can draw any conclusion from the rest, and plenty of advertisers realize at that point that they'd spent months reacting to swings that didn't exist.
Common questions
What are the most important Google Ads KPIs?
Only three decide your profitability: the number of conversions, their unit cost and their value. Every other metric (click-through rate, cost per click, impression share) is there to explain why those three move. On their own, they never tell you whether your account is making money.
What's a good CTR on Google Ads?
On the Search Network, the median observed across more than thirteen thousand US campaigns is 6.64%. It's a ballpark, not a target: a click-through rate is judged against your own history and your other campaigns, because it depends on your industry, your keywords and where your ads show on the page.
Should you track Quality Score as a KPI?
No, and Google says so itself: Quality Score is a diagnostic tool, not a key performance indicator, and it shouldn't be optimized or aggregated with the rest of your data. Use it to spot a poorly targeted ad group, never as a goal to push up.
Why does my cost per acquisition change so much from month to month?
Because a small number of conversions is very unstable by nature. At eight expected conversions a month, chance alone keeps the real count between three and thirteen in nineteen months out of twenty, and your cost per acquisition moves in the same proportion. Below about thirty conversions a month, a 30% swing proves nothing.