
5 steps to build your conversion funnel

Building a conversion funnel comes down to five steps: pick the action that ends it, split the journey into stages you can count, put tracking on each one, calculate the rate at every stage, then fix the one that loses more people than it should. The first four take a day. The fifth will keep you busy much longer, and that's how it should be: it's where the sales are won.
Most guides stop before the third. They draw a funnel in four layers, attract, engage, convert, retain, and leave you with a nice diagram that nothing measures.
I see the result on almost every account I take over. One overall conversion rate, a single number, and no idea where visitors are leaving. Here's how to build a funnel that tells you.
What is a conversion funnel?
A conversion funnel is the sequence of pages and actions a visitor goes through between landing on your site and taking the action you want: a purchase, a quote request, a call. Every stage loses some of them, hence the funnel image, wide at the top, narrow at the bottom.
In French, marketers call it a "tunnel", and the sales funnel you read about in most guides describes the same path. The label matters far less than what you can count along the way.
Models like AIDA (attention, interest, desire, action) or TOFU, MOFU, BOFU (top, middle and bottom of the funnel) describe something else: a prospect's state of mind over several weeks, from discovery to decision. They help you write the right message at the right time. No tool, however, can tell you at what minute a visitor moves from interest to desire.
The funnel this article is about is the other one, the one that lives on your site and can be counted page by page. It's the only one you can act on first thing Monday morning.
Step 1: pick the conversion that ends the funnel
A funnel is built backwards, starting from its exit. Before you think about pages, decide which action counts as success: the paid order for a store, the signed quote for a service business, the booked appointment for a tradesperson.
Just one. A funnel that ends on the newsletter signup, the guide download and the order all at once looks like a roundabout: everyone leaves it, and you no longer know which way.
The other actions stay useful: they become stages, or goals you track on the side. The practical rule comes down to one question: between this action and the money, is there still a stage you could count? If not, it's the exit. If so, it's a stage, and the exit lies further on.
One case often misleads, contact requests. A submitted form isn't a sale, and a funnel that stops at the form counts the curious along with the clients. If your sale closes outside the site, plan now to send back the next step, the signed quote: that's the whole subject of Google Ads lead generation.
Step 2: split the journey into stages you can count
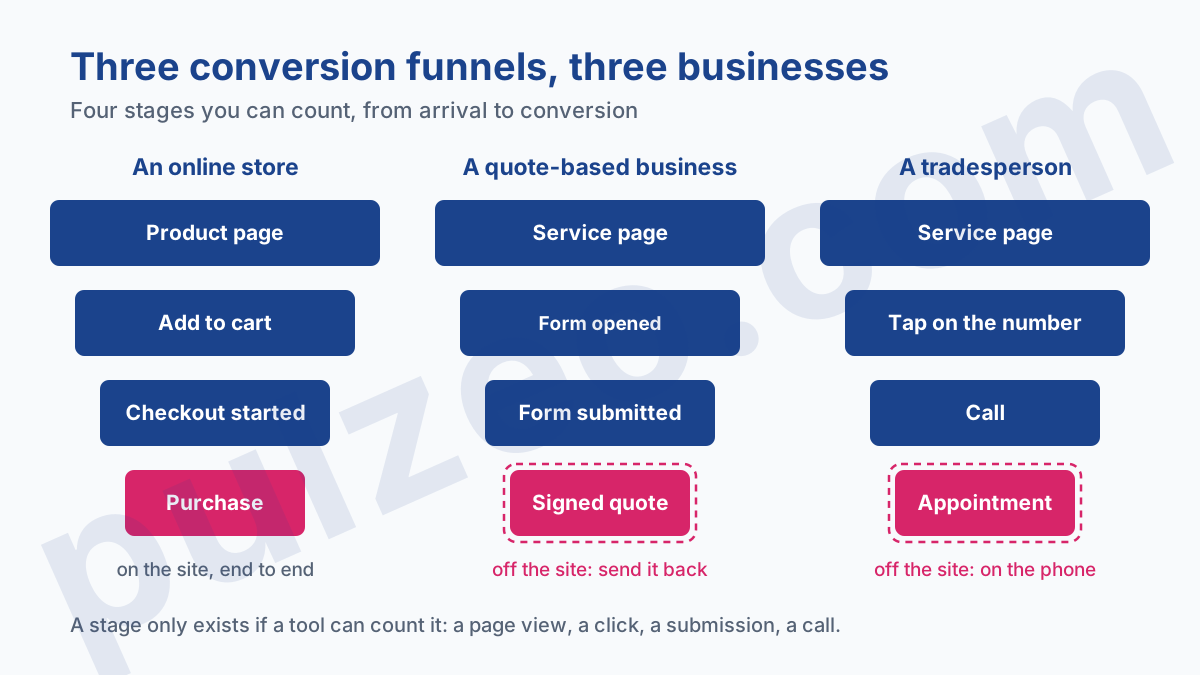
A stage only exists if a tool can count it: a page view, a button click, a submitted form. "The visitor feels reassured" isn't a stage. "The visitor opened the reviews page" is one.
Three to six conversion funnel stages are almost always enough. Beyond that, each stage only loses a handful of visitors and the breakdown teaches you nothing more. Below that, losses blend together and you won't know which one to tackle. Here's the breakdown I use in the three cases I come across most.
An online store
Product page, add to cart, checkout started, purchase. Google Analytics 4 provides an event for each in its list of recommended ecommerce events: view_item, add_to_cart, begin_checkout, then purchase.
On the common store platforms, an extension or Google's official integration often sends these events for you. Check that they arrive before recreating them by hand, or you'll count them twice.
A site that receives quote requests
Service page, form opened, form submitted, signed quote. The last stage happens outside the site, in your inbox or your business software.
That's why it's missing from most accounts. Yet it's the one that tells you whether the funnel makes any money.
A tradesperson waiting for a call
Home or service page, tap on the phone number, call, appointment. On a phone, tapping the number replaces the form, and I've seen more than one tradesperson lose all their tracking because their number wasn't clickable.
Not all calls are equal either. Google Ads lets you count only calls that last a minimum length, which you set yourself: one minute already filters out most wrong numbers and cold callers.
Step 3: track every stage in GA4 and in Google Ads
The two tools don't answer the same question, and you need both. GA4 sees all your visitors, wherever they come from, and can draw a funnel. Google Ads only sees the visitors from its ads, but it's the one paying for the clicks, and it needs to know which ones make it to the end.
In Google Analytics 4
The tool is called funnel exploration. You create it from the Explore menu by choosing that template, and it accepts up to ten steps. Two settings change the whole result, and hardly anyone looks at them:
- open or closed funnel: in an open funnel, a visitor can enter at any step; in a closed one, they must go through the first. For a purchase funnel, choose closed, otherwise visitors who land straight on the cart inflate the bottom steps;
- directly or indirectly followed: "directly" requires the step to come right after the previous one, with nothing in between. A visitor who checks your shipping costs between cart and checkout then drops out of the funnel. Keep "indirectly" as the default.
In Google Ads
Every intermediate stage can become a conversion action, on one condition: set it as secondary. The difference is spelled out in Google Ads Help:
These conversion actions are for observation only. They are used for reporting in the "All conversions" column in your reports, but not for bidding, even if the goal they are included in is used for bidding.
The same page sets out an exception worth knowing before you create your stages: a secondary action placed in a custom goal is used for bidding. So keep your intermediate stages out of any custom goal.
The mistake I find most often is add-to-cart set as primary. Smart Bidding then receives four or five "conversions" for one sale, shows a flattering cost per conversion, and learns to go after people who fill carts.
In Pulzeo, the "Create a conversion" tab creates the action in Google Ads and its tag in Google Tag Manager in one go, with a checkbox to keep it as observation only.
Step 4: calculate the conversion rate of each stage
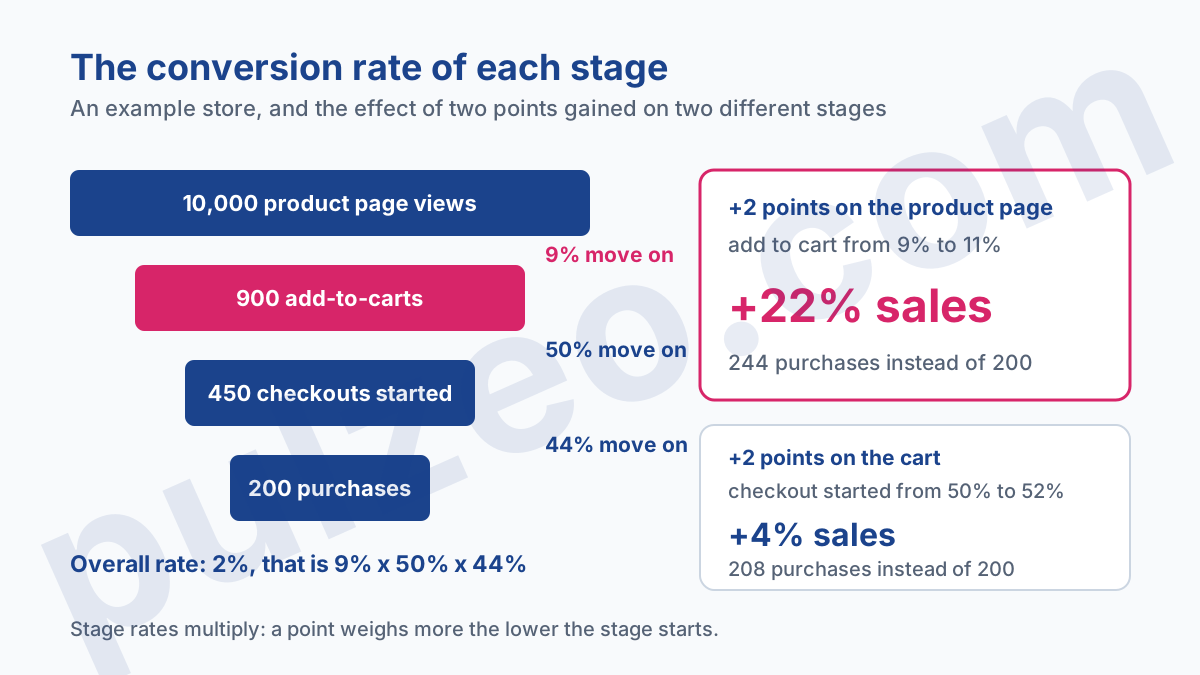
The conversion rate by stage is the number of visitors who get through the stage divided by the number who reached it. The funnel's overall rate, the one every dashboard shows, is nothing more than the product of these stage rates.
Take a store that gets 10,000 visitors a month on its product pages. 900 add an item to the cart, or 9%. 450 start checkout, half of the carts. 200 buy, or 44% of those who started. The overall rate is 2%.
Now gain two points on one stage, then on another, and watch sales. Taking the product page from 9% to 11% gives 244 sales instead of 200, or 22% more. Taking the cart from 50% to 52% gives 208, or 4% more.
The rule that follows applies to every funnel:
A point gained weighs more the lower the stage starts: two points mean 22% more sales at 9%, and only 4% at 50%.
Don't conclude that the product page always comes first: a point is often harder to win there than at checkout. Reason in sales gained for each point you aim for. To redo the math with your own numbers, our conversion rate calculator handles it.
One last caution about volume. I draw no conclusion from a stage that fewer than a hundred visitors got through over the period: at 30 passes, two clients more or fewer move the rate by nearly seven points.
Step 5: fix the stage that falls behind
The stage to fix is the one losing more than it should, and a rate can only be judged by comparing it: the lowest isn't necessarily the worst. A product page at 9% add-to-cart can be excellent for sofas and poor for socks.
Three comparisons are enough to find it, and I always run them in this order:
- the stage against itself, the previous month or the same season last year: a stage that drops suddenly has a specific cause with a date on it;
- mobile against desktop, at the same stage: a checkout that converts half as well on a phone almost always points to a form that's painful to fill in with a thumb;
- visitors from each campaign against the others: if only one source loses people at the cart, the problem is what the ad promised it.
Before touching anything, check that the tracking holds. A stage that drops to zero overnight is almost always a tag that stopped firing, and the list of causes is in the guide on misconfigured conversions.
For the checkout stage, the causes are known and well documented. The Baymard Institute, which compiles 50 studies, puts the average cart abandonment rate at 70.22%. A good share of it is unavoidable: in its survey of US online shoppers, 42% say they abandoned because they were just browsing.
For everyone else, the reasons read like a to-do list.
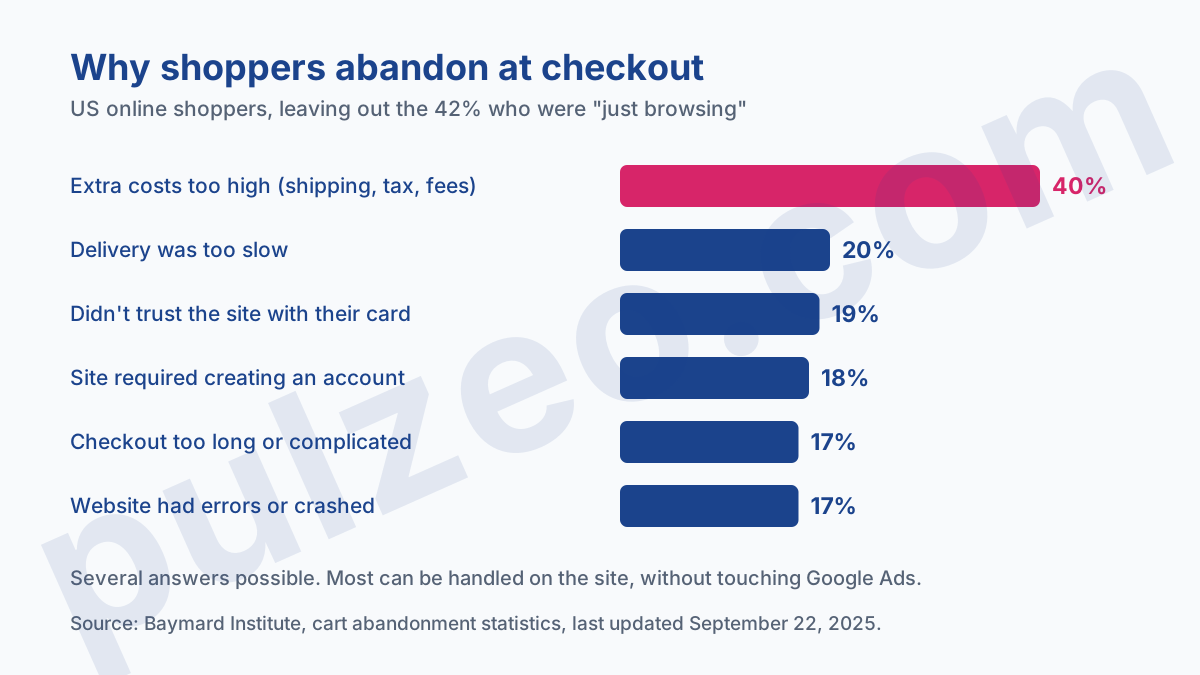
Most of them can be handled on the site, without touching Google Ads: show shipping costs before the cart, allow checkout without creating an account, display the total before the last step. Baymard counts 23.48 form elements on average in a US checkout, when a well-designed one can get down to 12 or 14.
Where does the funnel start for a visitor from Google Ads?
Not necessarily at the top. The search typed decides which stage the visitor enters at, and that's what makes a conversion funnel misleading when it mixes every source together.
Someone who types "hiking boots" is discovering, and enters at the top. Someone who types your brand name followed by "reviews" has almost decided: they're checking, and they're one stage away from the end.
That second visitor is increasingly common. In an op-ed published in September 2026 (in French), Google France notes that searches like "is this brand trustworthy?" are rising across Europe, and explains it this way: a suggestion made by an AI prompts the user to check it.
The consequence is twofold. Send each visitor to the page that matches the stage they're at, and read your funnel campaign by campaign. A brand campaign converting at 12% and a generic campaign at 1.5% don't add up to an average rate that means anything.
Aligning the search, the ad and the landing page has its own guide, in improving your Google Ads conversion rate.
The journey on the site remains GA4's job. Pulzeo watches both ends of it on the advertising side: the dashboard displays each account's funnel, from impressions to clicks to conversions, and the Conversions page checks that each action is set up correctly, including its counting and whether it's included in the "Conversions" column.
Common questions
What are the stages of a conversion funnel?
They depend on your business. For an online store: product page, add to cart, checkout started, purchase. For a service business: service page, form opened, form submitted, signed quote. For a tradesperson: page, tap on the phone number, call, appointment. The common rule is that a stage only exists if a tool can count it.
What's the difference between a conversion funnel and a sales funnel?
In everyday use, very little: both describe the path from first visit to the action you want. The real difference lies elsewhere, between the measurable funnel, which follows a visitor page by page on your site, and marketing models like AIDA or TOFU, MOFU, BOFU, which describe a prospect's state of mind over several weeks and can't be measured.
How do you calculate a funnel's conversion rate?
For each stage, divide the number of visitors who get through it by the number who reached it. The funnel's overall rate is the product of these stage rates: 9% adding to cart, then 50% starting checkout, then 44% buying gives an overall rate of about 2%. The stage-by-stage breakdown is what tells you where to act.
What is the average cart abandonment rate?
The Baymard Institute, which compiles 50 studies, puts the average cart abandonment rate at 70.22%. A large share of it can't be avoided: in its survey of US online shoppers, 42% say they abandoned because they were just browsing. Among the rest, 40% cite extra costs that were too high, such as shipping, taxes or fees.