
What is a good ecommerce conversion rate?

You want to know what a good ecommerce conversion rate is, and I'll give you the number right away: between 1% and 3.4% depending on the source and the device, around 2% if you only want one. There you go. You can close the tab.
Except that number won't do you any good, and I'm going to explain why before I give you the ones that actually matter.
An ecommerce average lumps together a grocer selling $12 coffee and a reseller selling $1,400 computers. It lumps together a phone on the subway and a desktop computer on a Tuesday afternoon. It lumps together a visitor who searched for your brand by name and one who clicked a banner between two videos. These people have nothing in common, and the number that claims to sum them up describes none of them.
What is the average ecommerce conversion rate in 2026?
Let's start with a clarification that'll save you some time, and it comes from the market where I work: no organization publishes a French ecommerce conversion rate.
The Fevad, the French e-commerce federation and the go-to reference in that market, measures revenue, transactions and average order value, not conversion rate. The figures you'll see quoted everywhere as "French" are recycled international surveys.
So the two serious sources are international, and you have to take them for what they are. Contentsquare publishes a benchmark built on 99 billion sessions, 6,000 sites and 64 countries. LittleData measured 2,800 Shopify stores in 2023, with an average of 1.4%, the top 20% above 3.2% and the top 10% above 4.7%.
And here's what nobody tells you: these two benchmarks don't agree. In food, Contentsquare records 6.80% where LittleData measures 1.5%. A factor of four and a half, in the same industry, between the two most-cited sources in the field.
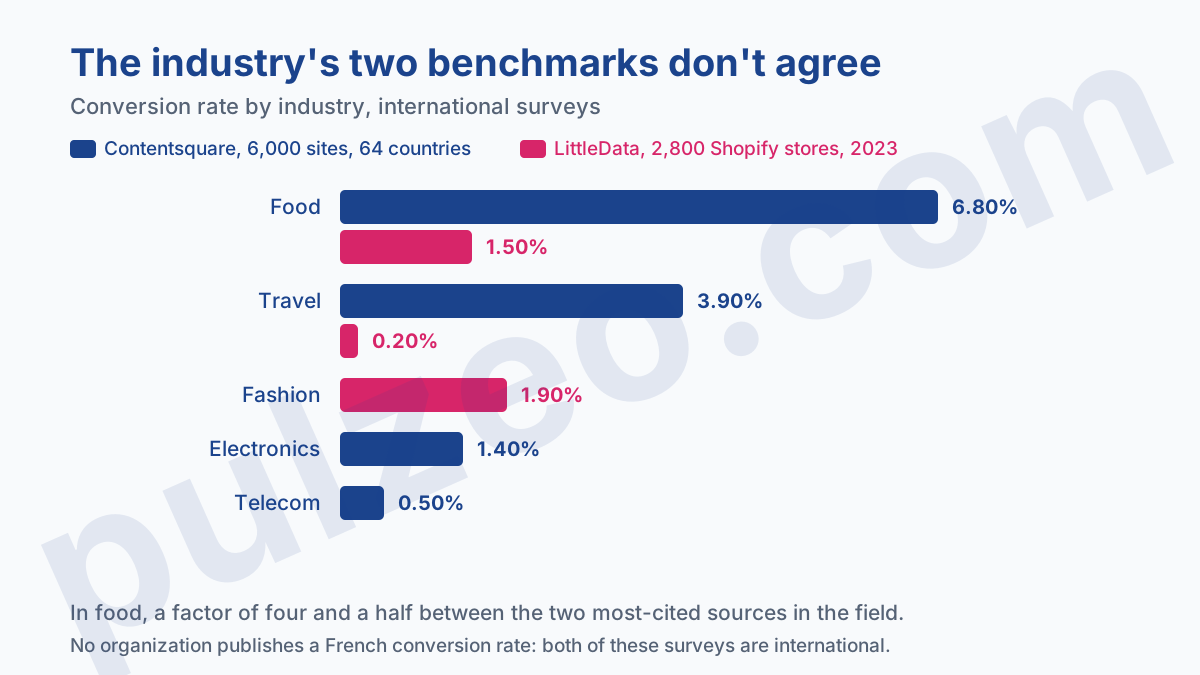
Take two things away from this breakdown of ecommerce conversion rates by industry. Within a single source, the gap between the top and bottom industries reaches a factor of thirteen at Contentsquare, from 6.80% in food to 0.5% in telecom. And from one source to the other, the same industry can vary fourfold, sometimes far more.
So comparing your number to an overall average is like comparing your temperature to that of the entire hospital ward, using a thermometer whose calibration nobody can vouch for.
Why your average describes none of your visitors
This is the point the guides skim over, and you can measure it on your own store in ten minutes.
The gap between mobile and desktop
Contentsquare measures 3.4% on desktop versus 1.6% on mobile, on 2025 data. A factor of two, on the same site, with the same catalog and the same prices. LittleData sees the same pattern across its Shopify stores, with 1.9% versus 1.2%.
The explanation isn't that mobile is somehow worse. It's that the two devices serve different moments of the same decision. The phone is for discovering, comparing, shortlisting. The computer is for finishing.
Here's a conclusion people rarely draw: if 70% of your traffic is mobile, which is common in 2026, your site-wide average gets automatically dragged down by a device that's doing its job well. You're not measuring a weakness, you're measuring a split.
Worse, a visitor who spots a product on their phone and buys it three days later on their computer counts as a failure on one side and a success on the other. Same person, same purchase, two rows that contradict each other.
The gap between your own pages
The second breakdown is even more telling, because you can act on it the same day. Pull the conversion rate of your ten most-visited product pages and look at the gap between the first and the last.
On the stores I look at, that internal gap almost always exceeds the industry gap everyone talks about. A product page with three photos and two lines of description doesn't convert like the fuller one next to it, on the same site and at the same price.
The same reasoning applies from one stage of the journey to the next, from product page to checkout: that's the subject of 5 steps to build your conversion funnel.
The gap between your price points
Third breakdown, and this one decides what you can hope for before you even open your site.
Shopify reports a consensus in marketing psychology that conversion rates start to fall past $50, then past $150, then past $500. It's not a measurement, it's an accepted rule of thumb, and I'm quoting it as such. The logic behind it holds up: the more money at stake, the more the decision takes time, comparisons and often a second person's go-ahead.
The French average order value gives you a sense of scale, and the Fevad does publish that one: €62 in 2025, down 3%, across €196.4 billion in revenue and 3.2 billion transactions.
One caveat before you compare yourself to it: that figure mixes products and services, and services make up the bigger share, €120.3 billion against €76.1 billion. So your competitors in that average are as much train tickets and hotel nights as stores like yours. A store with a $400 average order plays in a different league anyway and has no reason to measure itself against these benchmarks.
That's why I always ask for the average order value before I comment on a conversion rate. Without it, the percentage means nothing: 1% on $900 orders beats 4% on $25 orders, and that cuts both ways.
How traffic source changes your conversion rate
Here's the blind spot in articles on the subject, and it's also the one I know best, since you can read it straight from your campaigns.
Shopify mentions it in a single sentence, without a figure: a site that lives off advertising converts worse than one that lives off its existing customers or its social media audience. The first half is true, and that's where measuring it gets useful.
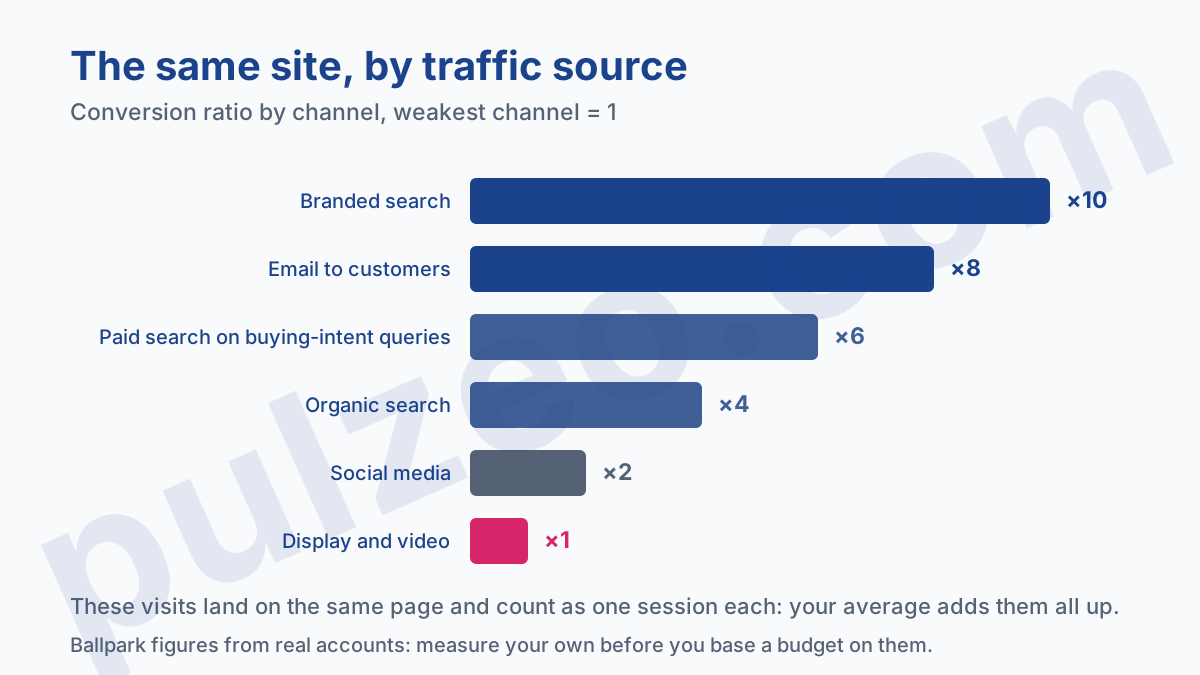
A visit that came in on a buying query, someone typing the exact name of your product plus the word "buy", has nothing in common with a visit from the Display Network, where the ad showed up next to a news article. The first person arrives with their intent already formed. The second was looking at something else.
These two visits often land on the same page, count as one session each, and end up in the same average. So an awareness campaign that does its job will pull your overall conversion rate down, and that's not a problem, it's just math.
A conversion rate that drops while revenue climbs isn't a warning sign: it's a sign you've opened a new channel.
Contentsquare puts a figure on the gap between two of these channels: 2.8% for paid search versus 0.7% for organic social, four times higher. On the accounts I take over, the order is almost always the same: branded traffic first, then email to your customers, then paid search on buying-intent queries, then organic search, then social media, and Display last.
Pulzeo pulls these conversions in, broken down by device and by campaign, which saves you from rebuilding that breakdown by hand in a spreadsheet every month.
So what conversion rate should you aim for?
Three benchmarks, in the order I use them when I take over a store:
- your own number from last month, segmented by device and by source;
- the top 20% of your industry, if you know it, rather than the average;
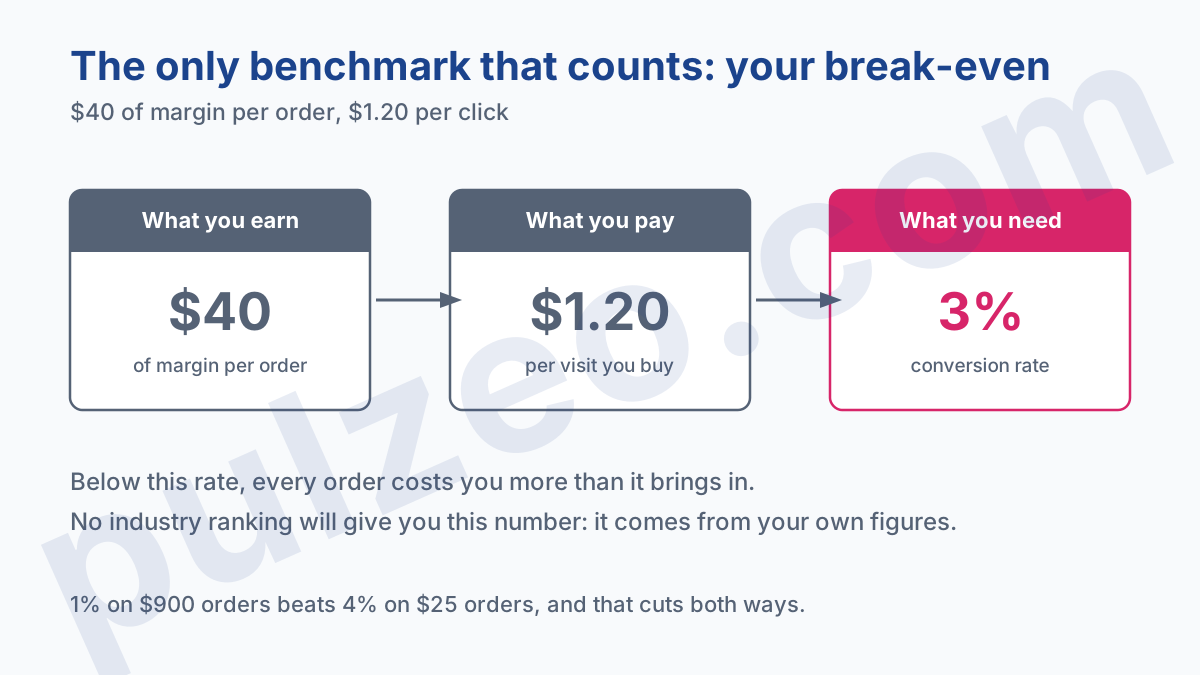
- the break-even point of your acquisition.
The first is the only one that tells you anything about your own work, because it's the only one where everything else stays constant. The second beats the average, which includes abandoned stores and broken sites: aiming for the average means aiming for documented mediocrity.
The third is the real one. If your average order leaves you $40 of margin and you pay $1.20 per click, you need 3% just to cover your costs. You won't find that number in any benchmark: it comes from your own figures. Our conversion rate calculator runs the math both ways.
How to read your number without fooling yourself
Four measurement traps, all seen on real stores, and every one of them produces a wrong number rather than a worrying one.
- Mixing two tools. Orders come from the store admin, sessions from the analytics tool, and the two don't count the same period or apply the same filters. Take both numbers from the same place.
- Counting unique visitors instead of sessions. The same person who comes back three times before buying makes one conversion for three sessions, not for one visit.
- Forgetting internal traffic. Your own visits, your agency's and the bots' inflate the denominator without ever buying anything.
- Ignoring off-site orders. A customer who calls after seeing your page counts as a failure, even though the page did its job.
That last point applies beyond ecommerce, and it's often what explains an abnormally low rate. If your tracking doesn't report orders correctly, no benchmark will save you: you'll be comparing a wrong number to a right one. The topic has its own guide, on misconfigured conversions.
What moves the needle when the number is bad
Once the number is reliable and segmented, the order of work is almost always the same, and it's not the one you'd expect.
You start with consistency between the promise and the page. An ad that talks about 24-hour delivery and a page that says nothing about it will produce a low rate without the page being bad. It's the cheapest lever, and I cover it in detail in improving your conversion rate.
Next comes sorting your traffic. Cutting the queries that bring in the merely curious raises the rate without touching the site, simply because you stop paying for visits that never stood a chance.
Rebuilding the checkout funnel comes last, whatever the articles selling optimization tell you. It's expensive, it takes weeks, and it never makes up for an intent mismatch further up.
One last word on how to size yourself up. The right move isn't to check whether you're above 2%, but to find out whether you make money at that rate. A store at 1.2% with $80 of margin per order is in far better shape than a store at 4% with $6 of margin, and no industry ranking will tell you that.
Common questions
What is the average ecommerce conversion rate?
The benchmarks you'll find are international. Contentsquare records 3.4% on desktop versus 1.6% on mobile, and LittleData measures a 1.4% average across 2,800 Shopify stores. In France, where I work, no organization publishes a national figure at all: the Fevad, the French e-commerce federation, measures revenue, transactions and average order value, not conversion rate. And the two sources diverge by a factor of four in some industries, which says plenty about what a single number is worth.
Why does mobile convert worse than desktop?
Contentsquare measures 3.4% on desktop versus 1.6% on mobile. The gap exists because the two devices don't serve the same moment in the decision. The phone is for discovering, comparing and shortlisting; the computer is for finishing. A mobile visitor who buys three days later on their computer counts as a failure on mobile and a success on desktop, even though it's the same purchase and the same person.
How do you calculate your ecommerce conversion rate?
Divide the number of orders by the number of sessions over the same period, then multiply by one hundred. One hundred orders for five thousand sessions gives you 2%. Always use sessions, not unique visitors, and check that both numbers come from the same tool: mixing the orders in your store's admin with the sessions in your analytics tool produces a false rate.
At what conversion rate should you start worrying?
There's no universal threshold, but two signals should set off alarms. A rate that drops by more than a third from one week to the next with no change in traffic almost always points to a technical problem, not a sales one. And a rate below 0.5% on paid search traffic signals a mismatch between what the ad promises and what the page shows.