
How to automate Google Ads client reports

If you run an agency, you know the evening I'm talking about. End of the month, 9 p.m., and you're still copying numbers into a report template for a client who's already asleep. The Google Ads client report you send out is probably the task you like least all month, and I get it: it's the agency's version of doing the dishes. It earns nothing, it never ends, and nobody thanks you for doing it.
Hours at the end of every month spent exporting, reformatting, writing commentary and checking that nothing's wrong. Time that doesn't earn you a dime and keeps you from doing what the client actually pays you for: optimizing their accounts.
The worst part is that this time doesn't create any value for the client either. Here's how to get out of that trap without turning your reports into generic charts nobody reads.
How long does a Google Ads client report take by hand?
Let's do the math, because people always underestimate the bill. If you manage fifteen accounts and each monthly report takes you forty-five minutes of exporting, formatting and writing, that's more than eleven hours a month. A day and a half of billable work, lost to formatting.
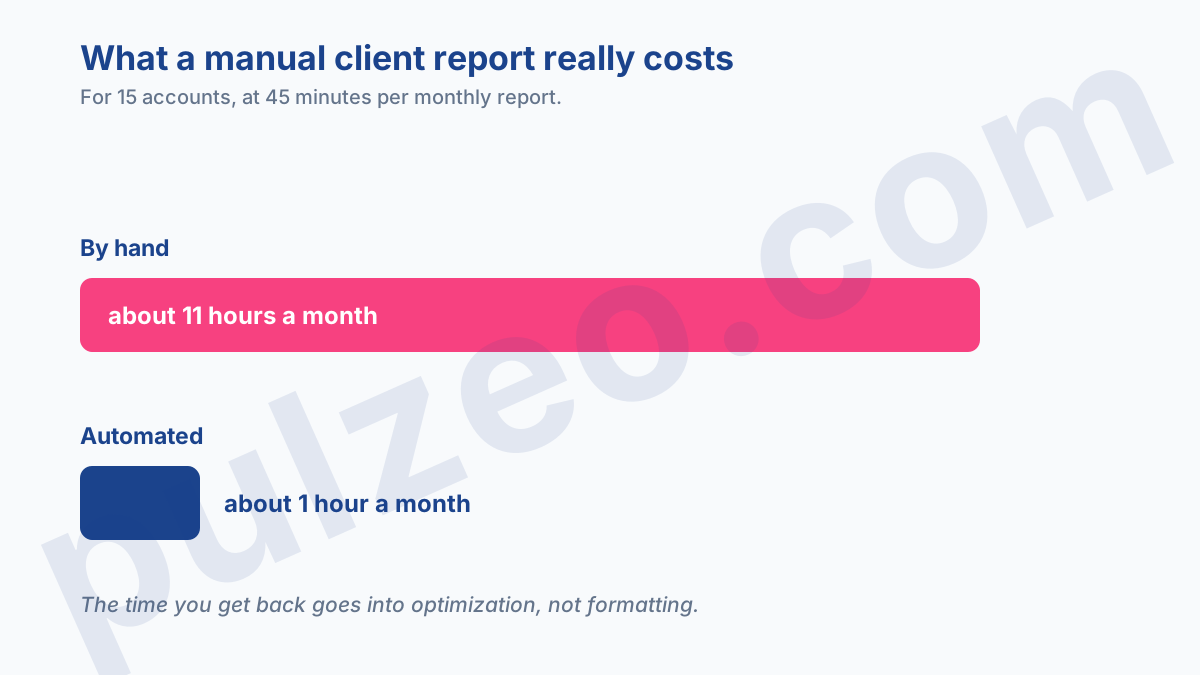
And those eleven hours create nothing. The client doesn't pay you for a pretty PDF, they pay you for results. The report should be a by-product of the optimization work, never a project in its own right that steals a day and a half from you every month. When producing the report becomes the bottleneck, that's a sign something has to change in the way you're organized.
And the real cost isn't even those eleven hours. It's what you would have done instead. Eleven hours of optimization on the accounts that need it means client budget better spent, better results, and clients who stay longer.
A manual report doesn't just cost you time, it costs you the results that time would have produced elsewhere. It's the kind of cost that never shows up on an invoice but weighs on the whole agency.
What makes a good client report?
Before you automate anything, you need to know what you're trying to produce. Automating a bad report just produces a bad report faster.
A good report gets straight to the point. The client wants to know three things:
- is it working?
- how much does it cost?
- what are we doing next?
Not forty metrics they don't understand, which worry them more than they help. A good report also speaks their language: "ROAS," "impression share" or "CPC" mean nothing to a contractor or a store owner, and a good report translates those ideas into dollars and concrete results.
It's consistent over time, with the same structure every month, so the client can follow the trend without having to get their bearings again with every report. Above all, it reflects the client's business. A lead generation account isn't judged on ROAS, and an ecommerce store isn't judged on the number of calls it gets. The report has to adapt to the business, not the other way around.
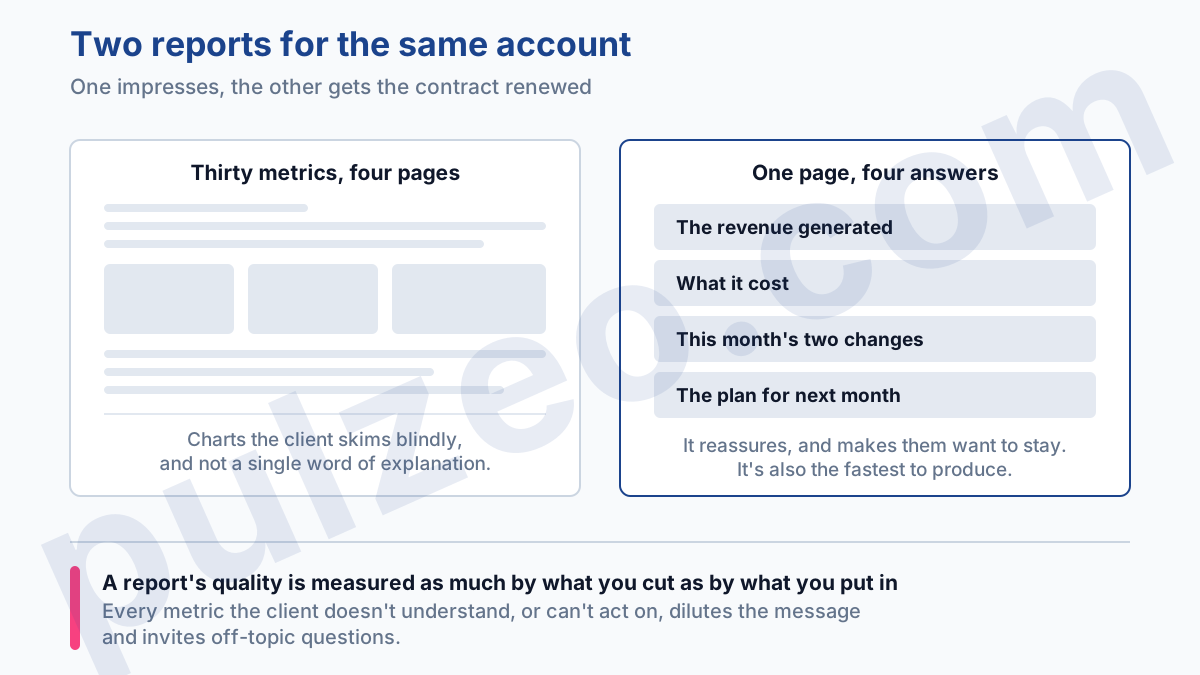
Take two reports for the same account. The first lines up thirty metrics over four pages, with charts the client skims without understanding a thing, and ends without a single word of explanation. The second fits on one page: the revenue generated, what it cost, the two changes made this month and the plan for next month.
The first impresses for five seconds; the second reassures and makes the client want to keep going. The second is the one that gets the contract renewed, and yet it's also the fastest to produce once production is automated.
How to automate a report without making it generic
The trap with typical automated reporting tools is that they spit out the same charts for everyone. The client can tell it came off an assembly line, and the document loses all its value as advice. You save time, but you lose what justified your fees.
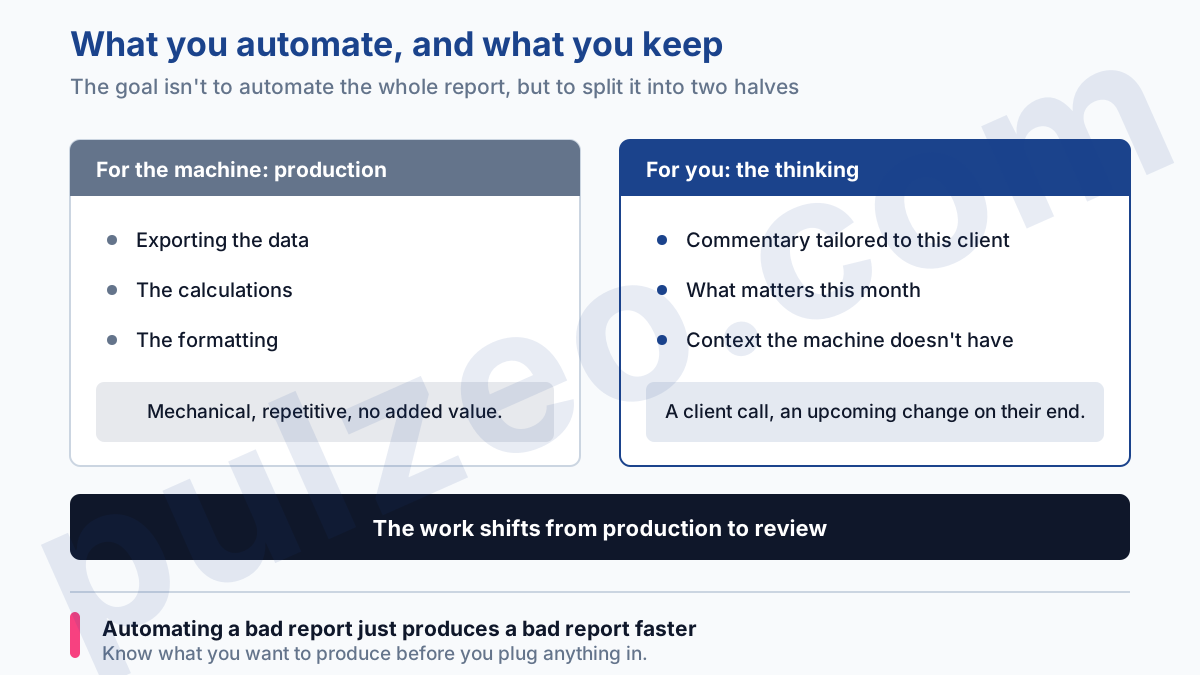
So the goal isn't to automate the report wholesale: it's to draw a clean line between two things.
Production: hand it to the machine
Production is the export, the calculations, the formatting. Mechanical, repetitive work with no added value that eats up the end of every month. That's exactly what you should automate, and only that.
The thinking: keep it for yourself
The thinking is the tailored commentary and highlighting what matters for this particular client that month. The machine does the chore; you keep the judgment.
In practice, the month plays out differently. Instead of blocking off half a day at the end of the month for fifteen exports, you open each report already assembled, read over the summary, tweak a sentence or two where you have context the machine doesn't (a call with the client, an upcoming change on their end), and hit send.
The work shifts from production to review, and that's exactly where your expertise is worth something to the client.
That's Pulzeo's approach. Client reports are generated from the account's real data, in your brand colors and with your logo, and the summary is written by Zeo with the client's profile in mind: a lead generation account gets commentary in cost per lead, an ecommerce account in revenue and ROAS.
You choose which metrics appear, you schedule delivery, and the client receives a clear, branded document they can understand without a glossary.
What should you put in a client report?
People often think a good report is a complete report. It's the opposite. A report's quality is measured as much by what you take out as by what you put in. Every metric the client doesn't understand, or can't do anything about, is a metric that dilutes the message and invites off-topic questions.
Keep what answers the three questions we started with, and cut the rest without regret. A chart of your search top impression rate only belongs there if the client knows how to read it, which is rarely the case.
On the other hand, one clear line on what you changed this month and what you plan to test next month is worth more than ten tables: it's what shows that someone is really steering the account. Choosing the numbers themselves is covered in the article on which metrics to track and which to ignore.
White labeling plays the same underlying role. A report with your name on it, with no Google logo and no mention of a third-party tool, quietly reminds the client that you're the one at the helm. It's a detail, but it's the kind of detail that carries weight when renewal time comes around.
How monthly reports help you keep clients
We think of the report as an obligation. It's actually one of the few moments when the client gets to see exactly what you do for them. Between reports, your work is invisible: they don't see the bids you adjusted, the negative keywords you added or the ad tests you ran. The report is the window through which they judge whether their money is being managed well.
A clear, regular, branded document builds trust month after month. A late, unreadable or generic report does exactly the opposite, even when the account is performing very well.
And that's even truer in bad months. The rookie reflex is to bury a disappointing month under charts, hoping the client won't notice the drop. They always notice, and the silence worries them more than the number.
A good report names the bad month, explains what caused it and what's already underway to fix it. A client will accept a weak month that's been explained; they won't forgive a weak month that's been hidden. In fact, it's when the numbers are against you that the report proves most clearly there's a pilot on board.
I've seen a client leave even though their performance was excellent, simply because their reports arrived late and they couldn't make sense of them. The work was good, the communication wasn't, and the communication was what they saw.
A lot of contracts are lost that way: not over results, but over the impression that nobody's really taking care of the account. Automating production so you can give that moment the attention it deserves isn't just a time-saver, it's an investment in retention.
How much time does automation save?
That's the real question, and it's where automation becomes profitable rather than just convenient. The hours you no longer spend formatting reports can go back to the work that matters: actually optimizing accounts, which is what the client pays you for, taking on more clients without hiring, or simply getting your end-of-month evenings back.
The math is simple. Getting a day and a half back each month means two or three more clients managed with the same headcount, or a small agency's margin swinging from red to black. Over a year, you're not saving hours, you're unlocking room to grow.
And producing reports is just one of an agency's recurring chores. The same logic applies to monitoring several Google Ads accounts or to the regular audit: anything mechanical and repetitive can be automated to free up your judgment where it creates value. That's the whole idea behind a tool built for agencies rather than yet another dashboard.
If you're still torn between us and another tool, we've compared ourselves head-to-head, no punches pulled, with Looker Studio and Optmyzr.
A client report should never steal your end-of-month evenings. Automated well, it stops being a chore and becomes a real selling point.
Common questions
How often should you send a Google Ads client report?
A monthly cadence suits most budgets: frequent enough to show the work, far enough apart to let optimizations take effect. On large budgets or campaigns that move a lot, a shorter weekly check-in is a good complement to the in-depth monthly report.
What should a Google Ads client report include?
Three things, above all: is it working, how much does it cost, and what are we doing next. The metrics should match the client's business (cost per lead for lead generation, revenue and ROAS for ecommerce), not a standardized grid of forty metrics that nobody reads.
Do you need a white-label report?
For an agency, yes: a report in your brand colors and with your logo strengthens your perceived value and keeps Google or a third-party tool from stealing the spotlight. White labeling turns a technical document into a consulting deliverable that carries your name.
How long does it take to automate your reporting?
The initial setup (connecting accounts, choosing metrics, building the template) takes a few hours, once. After that, each report is generated in a few minutes instead of forty-five. The time invested up front pays for itself within the first month or two.